ETX Module: Introduction to the EU Emissions Trading System
How did EU ETS start?
The European Union planned to reduce greenhouse gas emissions by establishing a carbon tax already in 1992. However, under the Treaty of the European Union, this move required the unanimous agreement of all EU member states (12 at the time). After almost a decade of difficult negotiations the carbon tax approach was abandoned. The European debate on carbon pricing instruments then shifted from taxation to capping and trading emissions. The mantra of ‘cost efficiency’ took centre stage and, vitally, possible legislation for emissions trading at EU level would require decisions through qualified majority voting by member states instead of the unanimity required for fiscal measures like a carbon tax.
In March 2000 the European Commission presented a green paper on “Greenhouse gas emissions trading within the European Union” with some first ideas on the designs of the EU ETS. It served as a basis for numerous stakeholder discussions that helped shape the EU ETS in the first phases.
In 1997 the Kyoto protocol was signed. For the first time 37 industrialised nations made legally binding undertakings in regard to their emissions of greenhouse gases for the period 2008-12.
What is the EU ETS?
The European Union’s Emissions Trading System (EU ETS) is one of the main tools with which the EU hopes to combat global heating and reduce greenhouse gas (GHG) emissions cost effectively. It is a regulatory market, meaning it has been created by policymakers instead of just being the result of market forces. The main legislation setting out the Emissions Trading System’s governance and functioning is the EU ETS Directive, which aims to set in motion “cost-effective and economically efficient” and “scientifically necessary to avoid dangerous climate change”.
The EU ETS is meant to apply the ‘polluter pays principle’, meaning that the costs of pollution should be borne by those who create it. Launched in 2005, the EU ETS is the oldest emissions trading scheme in the world. It was also the largest until 2021 when the Chinese ETS kicked off.
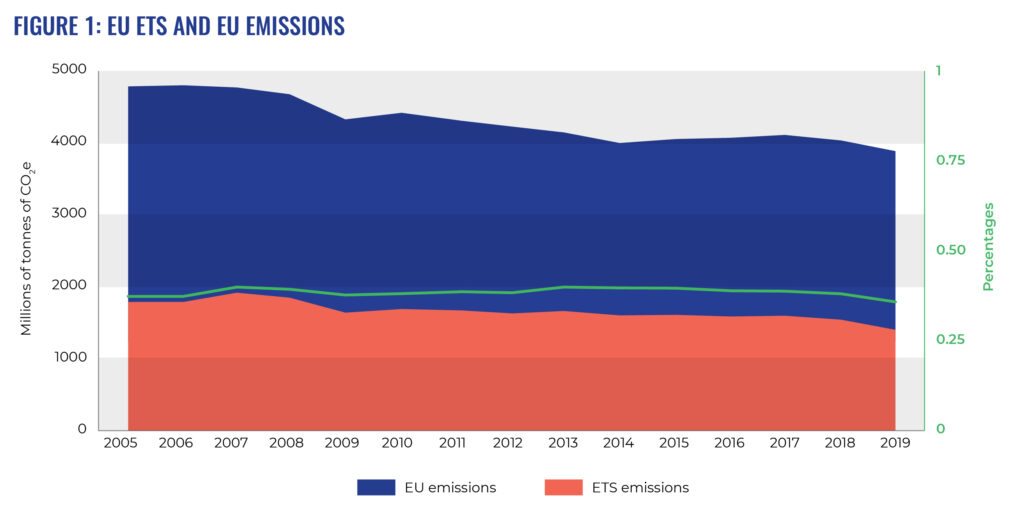
In 2021, the EU ETS covered over 10,400 industrial plants and power stations, as well as approximately 350 airlines, across the 27 EU member states, Iceland, Norway and Liechtenstein (there is also a link with the Swiss ETS, and power plants in Northern Ireland are covered even after Brexit). In 2013, the EU ETS covered approximately half of all EU’s GHG emissions. That dropped to 36% in 2020 because EU ETS sectors, in combination, are reducing their emissions faster than the rest of the economy.
LEARN MORE
The EU ETS is a ‘cap and trade’ system. This means that it sets an overall limit (a ‘cap’) on the total volume of greenhouse gas (GHG) emissions that installations in the covered sectors can cumulatively emit. The reduction targets set for the EU ETS sectors by EU policymakers are achieved through the gradual lowering of this cap.
The key sectors in the EU ETS are the electricity sector, heavy industry and aviation. The ETS deals with six greenhouse gases, though not in every sector covered.. For example, CO2 from power and heat generation, flights and many energy-intensive industries is included, but only perfluorocarbons (PFCs) from the production of aluminium are included.

The cap is divided into pollution permits known as EU Allowances (EUAs). One EUA represents one tonne of CO2 equivalent emissions. In 2021, the cap was approximately 1.57 billion EUAs. Installations covered by the EU ETS are obliged to annually hand over (also known as surrender) EUAs equal to their emissions the previous year. For example, an installation that emitted 1 million tonnes of CO2 in 2020 would need to transfer 1 million EUAs to the European Commission’s central registry in 2021.
Companies can acquire these EUAs through three main channels:
- Buy them at auction: auctions are organised by the European Energy Exchange, with the revenues going directly to the EU’s 27 member states according to a predefined division key.
- Receive them for free: sectors deemed to be at the risk of carbon leakage, the aviation sector, and for electricity production in some lower-income member states receive free allocations
- Buy them on the open (or so-called secondary) market: there are several trading platforms where ETS operators (or others such as financial institutions) can trade allowances between each other. Transfers of EUAs can also be included in other contracts (for example for the purchase of heat or electricity)
Companies can buy and sell allowances, including those they received for free, on the open market and trade them with each other. This is what the ‘trade’ part in ‘cap and trade’ refers to. For example, if a company has succeeded in lowering its emissions particularly fast, it can sell its spare allowances to another company or save them for future needs – this is called ‘banking allowances’. This trading element is the part of the EU ETS that should, in theory, enable cost-efficient decarbonisation, meaning that the cheapest emission reductions take place first. However, a carbon market on its own is not fit to address non-market barriers (for example, lack of capital to invest in energy savings) or to help develop innovative clean breakthrough technologies.
The overall cap is enforced through limiting the supply of EUAs: each year only as many EUAs are made available through auctions and free allocations for companies as the cap for that year. The cap is reduced each year, to ensure GHG emission from the involved sectors decrease as well. Companies in the ETS are aware of this reality. They understand that, in theory, this means that EUAs will become increasingly scarce and costly over time, even if this was not the case in the early years after the system was introduced. The cost of acquiring an EUA now and in the future gives companies, in principle, a financial incentive to reduce emissions. Either these companies continue to pay for high continued emissions, or they invest in technologies and projects to reduce their emissions and thereby the amount of EUAs they need.
Companies have to comply with the obligation to accurately measure and report their emissions, and to surrender the appropriate number of allowances. For each tonne of emissions they fail to report and surrender an EUA for, they must pay a €100 fine on top of the EUA they must hand over.
The cap decreases by a fixed amount each year, which is calculated using the so-called linear reduction factor (LRF). The LRF is expressed as a percentage of the 2013 total cap. For 2013 to 2020, the LRF was set at 1.74% (about 34 million EUAs a year), and starting in 2021 it is set at 2.2% (about 43 million EUAs a year).
There is a direct correlation between the LRF and climate ambition: the higher the LRF, the lower the emissions. Unsurprisingly, the size of this factor has become a central issue in negotiations around reforming the EU ETS. The European Commission has proposed to increase the LRF to 4.2% as of 2024. While this is an improvement, it does not go far enough and Climate Action Network Europe (CAN Europe – an umbrella organisation representing NGOs working on climate change in Europe) states that it should be 5.4%.
The impact of the various heights of the LRF on the EU ETS cap can be seen in the graph and table below. The current LRF of 2.2% (blue line) is compared to the European Commission’s proposal of July 2021 (red line) and the LRF of 5.4% proposed by CAN Europe. This higher LRF is necessary to reduce the size of the Emissions Trading System by 70% by 2030 against 2005 levels (yellow line).
The more ambitious target proposed by activists would drastically lower the total emissions still available through the EU ETS, to just under 11 billion tonnes, compared with 14.3 billion tonnes under the Commission’s proposal and a whopping 28 billion tonnes if the current status quo were to continue. In addition, the CAN Europe proposal would also bring the ETS to zero by 2036, more than two decades ahead of the status quo and five years earlier than the Commission’s proposal.
Note that the cap for 2013-2020 is a simplified retroactive calculation from the 2021 cap to take Brexit into account, using the actual LRF for that period (1,74%).
Source: Carbon Market Watch calculations based on European Commission data
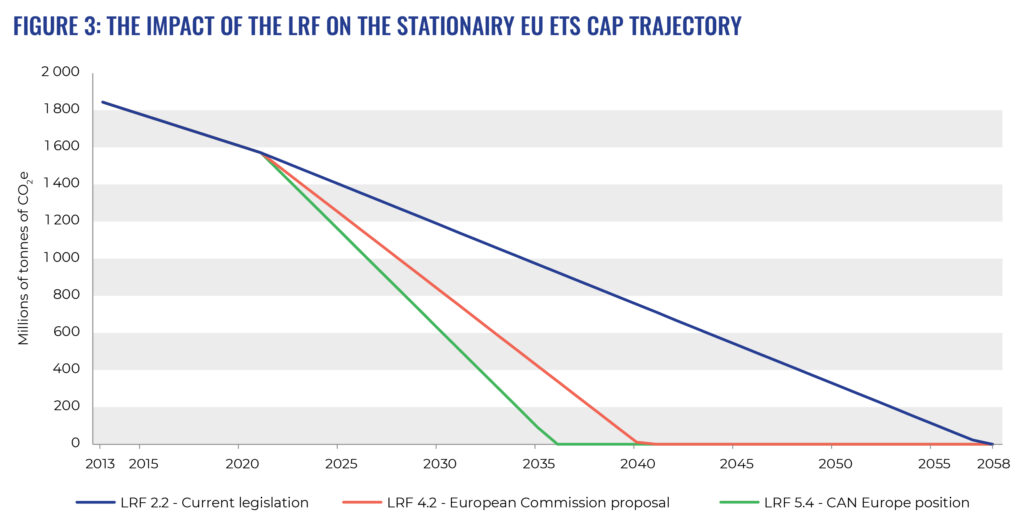
Table 1 shows the impact of increasing the LRF in 2021, utilising the same three LRFs as in Figure 3
So while the LRF may appear small, it is crucially important for the functioning and ambition of the EU ETS. It sets the supply of EUAs, determines the available decarbonisation pathways and the total carbon budget. This means that the LRF has a massive impact on the environmental integrity of the ETS and the behaviour of the companies governed by it.
One of the main ghosts to haunt the EU ETS ever since its inception is carbon leakage. Carbon leakage is the hypothetical situation that European companies competing at international level would shift their production and/or investments (and pollution) to countries with less stringent or no climate policies. Thoeretically, this could even result in higher GHG emissions. The spectre of carbon leakage is the justification for the generous levels of free allowances offered to European heavy industries, in the hope of keeping them operating in the EU until they switch to clean production methods.
However, for industrial sectors like steel, cement and chemicals empirical evidence reveals that carbon leakage has not transitioned from the realm of theory to the real world. This lack of historical evidence for carbon leakage could be either related to the EUA price being too low in the past and/or existing carbon leakage protection mechanisms. and research suggests that this risk has little chance of materialising in the future, even with rising carbon prices.
Despite the clear evidence that carbon is not leaking out of the system, carbon leakage receives enormous political attention (often spurred by vested interests of industry stakeholders) in the policy design of the EU ETS.
Carbon leakage protection mechanisms seek to protect high emitters by supposedly levelling the playing field – either by taking away, or compensating domestic producers for, carbon costs or by imposing a similar cost on foreign producers exporting to the EU. However, carbon leakage protection has been shown, in certain situations, to undermine the core polluter pays principle of the EU ETS, creates windfall profits for some industries and decreases the system’s ability to positively influence the behaviour of companies. Shielding polluters from the cost of pollution undermines the incentive for industry to switch to cleaner production processes and contribute to meeting Europeʼs climate goals.
There is also an equity angle to this. Currently heavy industry does not really pay for its pollution, but in some countries ordinary people do. For example, in Sweden, there is a carbon tax on motor and heating fuels, while industrial concerns are exempt from national carbon taxes due to their inclusion in the EU ETS. In addition, the European Commission has proposed, under the Fit For 55 package, a separate ETS for transport and buildings where households will have to pay for their transport and heating emissions while industry would still not pay for their pollution. Free allocation also means that society loses the foregone revenues that could have been invested in greening our society and economy, while future generations are burdened with the costs of cleaning up this free pollution and dealing with the disastrous climate impacts it will cause.
Under the Emissions Trading System, free emissions allowances are the key mechanism to protect industry and aviation from the presumed but unproven risk of carbon leakage. Over Phase 2 and 3 (2009 – 2020), about €200 billion worth of EUAs were handed out at no cost to heavy industry.
Despite auctioning being the default rule in Phase 4 (2021-2030), for industry the sale of EUAs remains the exception: more than 95% of industrial emissions continue to be covered by free emission allowances. The Court of Auditors, the EU’s external financial auditor, concluded that free allocation to the industrial and aviation sectors was not based on their ability to pass through their direct ETS costs (i.e. their cost of acquiring EUAs) and that there is a need for more targeted free allocation. In addition, it states that free allocation even tended to slow down decarbonisation efforts.
This trend is nowhere more apparent than in the diverging trajectories of heavy industry and aviation when compared with electricity and heating. Power generation has not received free allocations since 2013. As noted earlier, industrial emissions have stagnated over the past decade and aviation emissions continue to grow, despite the generous subsidies they have received. In contrast, the power sector has implemented deep and sustained emissions cuts.
These free permits are a market failure since the external costs of carbon pollution (climate breakdown and the public health consequences of air pollution) are not borne by the producer, allowing companies to unfairly maximise their profits while leaving society to carry the tab for their pollution.
Additionally, by handing out free pollution permits EU member states forego auctioning revenues which could have been spent on further climate action, leaving the burden of this investment on other sectors of society. Between 2021 and 2030, another 6.5 billion emission allowances are planned to be handed out for free. This would represent another free pollution subsidy of over €325 billion (at an EUA price of €50).
For industry, the method for deciding who gets how many free allowances is complex and consists of two parts:
- Determining which industrial sectors are considered at risk of carbon leakage
- Calculating how many allowances an individual installation in those sectors should receive
The list of sectors at risk (the so-called carbon leakage list) is supposed to be a tool to focus free allocations on those sectors that are truly in danger of being undermined by highly polluting foreign competition or of relocating rather than eliminating their polluting operations. The sectors on the list get 100% free allocation at benchmark level (which is explained in detail below). However, even sectors not on the list still receive 30% free allocations (which should decrease to zero starting in 2026).
While this ‘carbon leakage list’ is supposed to help focus on those sectors really at risk, in practice practically all industrial sectors are included. Sectors representing 94% of EU industrial emissions appear on it for Phase 4, a measly drop from the 98% during Phase 3.
Once a sector is on the list, individual installations receive 100% free allocations based on the emissions intensity of their production compared to other installations in their sector. This is operationalised using so-called product benchmarks set as the average emissions of the 10% least emission intensive producers of a given product across the EU ETS (independent of technology, fuel or production process used).
Every installation in the sector receives free allocation at the benchmark level. Those who are less emissions intensive than the benchmark actually receive more allowances than they need, while those emitting more have to acquire additional EUAs. The logic behind this is to reward the most efficient installations, while encouraging those running behind to catch up to (and hopefully) overtake the benchmark. Starting in Phase 4, the benchmarks will be improved annually, but at such a snail’s pace (between 0.2 and 1.6%) that it is likely to provide little incentive for industrial sectors to reduce their emissions.
Heavy industry is so awash with free permits that almost no extra allowances need to be bought. In 2017, 2018 and 2019, free allocation covered 98.8%, 96.8% and 97.5% of industrial emissions respectively. Before that all industrial sectors together received more than they needed till 2016, and between 2006 and 2020 they accumulated 966 million more free allowances than they needed to surrender.
However, there are limits on the amount of allowances that can be allocated for free to industry. Throughout Phase 3 the amount determined using the carbon leakage list and the benchmarks always exceeded that limit. This meant that free allocation needed a ‘haircut’: all industrial installations annually had a percentage subtracted from their free allocation. This so-called Cross Sectoral Correction Factor (CSCF) reached 78% by 2020 (meaning 22% of free allocations were withheld).
Things have changed for Phase 4 because 57% of all allowances have to be auctioned , though 3% of all allowances can be made available for free to industrial sectors in case the limit on free allocations is reached. Therefore, the CSCF is unlikely to play a role until late in Phase 4 because the sum of free allocations till then is unlikely to exceed that limit.
The aviation sector also receives copious amounts of free allowances, only having to buy 15% of the allowances they need compared to baseline emissions at auction. The remaining 85% is received for free.
In addition to the free ETS allowances, a number of heavy industry sectors are entitled to state aid subsidies. These sectors include large electricity consuming sectors like aluminium, chemicals, paper and pulp, steel and iron, oil refineries, non-ferrous metals and some plastics. This state aid takes the form of cash payments from the member states the installations are located in to protect them from the carbon leakage risks caused by utilities passing on their own direct EU ETS costs via electricity bills.
These state aid schemes are regulated by a set of EU guidelines to limit competitive distortions between countries. However, as member states can choose whether or not to subsidise industry using these guidelines there is a race to the bottom: countries who don’t give their industries these subsidies place them at a competitive disadvantage compared with those in countries that do hand out the subsidies.
Sums paid out by these state aid schemes have skyrocketed recently, not only due to rising EUA prices, but also because more countries, encouraged by industry lobbies, are implementing their own state aid schemes. In 2018, just over €460 million were paid out in 10 member states (+UK). By 2020, that had tripled to nearly €1.4 billion euros in 13 member states (+UK). These member states paid out the equivalent of 8% of all their auction revenues in 2019 to prop up polluting industries, which increased to a whopping 13.7% in 2020.
In 2021, two more member states started handing out taxpayers’ money using this scheme (Italy and Czechia), bringing the total to 15 out of 27 member states, including the 10 largest.
These expensive state aid schemes are overly generous and wholly unnecessary. A study conducted for the European Commission found no proof of carbon leakage due to indirect EU ETS costs from the utilities sector being passed through to industry. Some of the industries eligible for this state aid are very unsustainable and polluting, such as oil refineries and plastic producers. The list was also expanded with a blackbox qualitative assessment – adding some sectors that were deemed undeserving by the Commission’s own consultants .
The formula to calculate the amounts that can be paid out to individual industrial plants is also overly generous. It assumes that every factory only buys the dirtiest electricity in its region, and ignores energy efficiency and renewable energy developments.
The money is also handed out without any real strings attached. Conditions could have ensured the state aid brought about some climate benefit. For example, sectors who receive these public funds could have been mandated to use the subsidies to reduce their emissions or energy use.
The Market Stability Reserve (MSR) is a supply control mechanism – and can limit the number of EUAs in circulation on the EU ETS market. It works on an annual cycle. Each year the European Commission calculates the ‘total number of allowances in circulation’ (TNAC) – which in essence represents the oversupply under the EU ETS. It subtracts how many allowances have been put in the market (=supply; free allocation + auctioning) in the past minus how many have been taken out (=demand; surrendered EUAs+what has already been put in the MSR). If this number is greater than 833 million, a part of the oversupply is transferred to the MSR (the so-called intake rate is 24% until 2023, and 12% from 2024 onwards).
The surplus allowances in the market are not in the hands of the European Commission or member states – they are being held by the private entities that have acquired them through auctions, free allocation or on the secondary market. The Commission cannot just ‘recall’ these allowances to put them in the MSR – instead allowances are taken from auctions that member states would due in the coming year and placed in the MSR
The MSR doesn’t just soak up the oversupply, it will also start ‘retiring’ (i.e. deleting or cancelling) EUAs in 2023 – every allowance held above the volume auctioned the year before will be automatically cancelled. This mechanism will play a major role starting in 2023, as the MSR currently already contains over 1,9 billion allowances and only around 780 million EUAs were auctioned in 2020. The MSR would therefore already cancel over a billion EUAs this year if the cancellation mechanism was already operational – and that number will be significantly higher by 2023 as the MSR continues to suck surplus out of the EU ETS market the coming two years, and auctioning volumes decline in line with the decreasing EU ETS cap.
The MSR is also designed to play a role in case the EUAs in circulation are considered too few for market functioning and liquidity. If the oversupply is lower than 400 million the market is considered by policy makers ‘too tight’, and then the next year an additional 100 million EUAs will be taken from the MSR and auctioned.
The Market Stability Reserve has proven effective in supporting the carbon price since it started operating in 2018. Market participants seem to understand that the MSR is going to have its hands full bringing the years of oversupply to an end. However, the MSR was only designed to tackle the historic oversupply, and it is not fit to deal with current or future surpluses or shocks (for example the COVID-19 pandemic, economic downturns, planned coal plant closures etc.).
The MSR will not be sufficiently strong to protect the EU ETS from such sources of oversupply: current national coal phase-out plans could add another 2.07 billion EUAs to the oversupply between 2021 and 2030. The MSR needs to be bolstered if this additional oversupply (and others that might come from economic shocks or the COVID-19 pandemic) is to be kept from sinking the carbon price again.
Strengthening the MSR will be necessary to prevent another price crash, and the main tools to do so are to increase the intake rate to 36% from 2024 onwards, reduce the MSR thresholds over time and automatically cancel allowances held in the MSR for more than 3 years.


